Using the Director Debugger
June 13, 2000
by Irv Kalb
The Debugger is an extremely powerful feature of Director. If used correctly, it can dramatically speed up your development time. The amount of time spent learning to use the Debugger is an investment that will pay for itself many times over.
What does the Debugger do?
To start with, the term "Debugger" is a bit of a misnomer. A debugger never gets rid of bugs. If it did, many of us would be out of a job. Instead, it is a diagnostic tool that will help you find the cause of bugs in your program. The Debugger allows you to stop the execution of your program at any line of code, look at the value of your variables, see how you got to where you are, and continue execution on an incremental basis.
Consider this scenario. You run your program and something goes wrong. You know there is a problem because a result that you expect to get is not occurring, or perhaps you are generating a script error. You probably have an idea of what may be the cause, but you don't know exactly what. Without a debugger, the typical tools that you can use are "put" statements, the Message window and "alert" statements. Typically, put statements can be used to write out the value of variables to the Message window, and embedding alert statements into your code can allow you to trace the execution of your code. The Debugger gives you all this functionality integrated into one convenient, powerful tool.
How to use the Director Debugger
When you want to use the Debugger, you have to make a decision about where you want the execution of your program to stop. Open a script that you want to debug, find a particular line where you want your program to stop, and click in the left column next to a line of code. A small red stop sign icon, called a breakpoint, shows up. This tells Director that you want to stop before executing this line of code. You can set as many breakpoints as you want. To eliminate a breakpoint, just click on the stop sign.
When you have set one or more breakpoints, run your program. Whenever the program reaches a breakpoint, the execution of the program is temporarily suspended and the Debugger window comes up. The Debugger window shows you the current script, a list of handlers in the order that they were called, and the values of all your local variables. After examining the state of the program, you can choose to execute a single line of code, or allow the program to run normally.
A Sample Debugging Session
Suppose that you were writing a program that would return "Good Morning" or "Good Afternoon" (whichever was appropriate) and give the time, when you clicked on a button called Update. Here is some sample code that attempts to do just that:
on startMovie
member("Display").text = " "
end
on ShowTime
timeRightNow = the long time
AMorPM = GetLastTwoChars(timeRightNow)
timeOfDay = StripLastThreeChars(timeRightNow)
case AMorPM of
"AM":
stringOut = "Good Morning, the time is:"
"PM":
stringOut = "Good Afternoon, the time is:"
end case
member("Display").text = stringOut && timeOfDay
end
on GetLastTwoChars stringIn
nChars = the number of chars in stringIn
lastTwoChars = char (nChars - 2) to nChars of stringIn
return lastTwoChars
end
on StripLastThreeChars stringIn
nChars = the number of chars in stringIn
timeWithoutAMorPM = char 1 to (nChars - 2) of stringIn
return timeWithoutAMorPM
end
Download a Director 7 sample movie in Mac or PC format.
In order to make all this run we need a button called "Update". When you click on the Update button, it calls the ShowTime handler. Run the movie and click on the Update button and it correctly prints the time, but it doesn't say "Good Morning" or "Good Afternoon". What is wrong? Let's use the Debugger to find out.
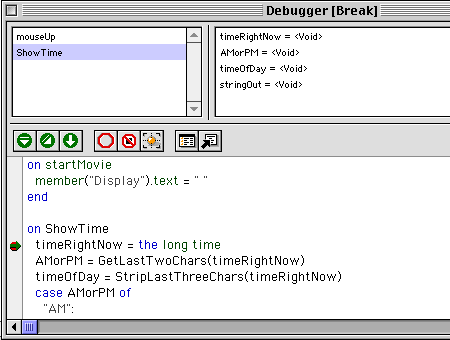
Since you know that when you click on the Update button, Director calls the ShowTime handler, let's put a breakpoint on the first line of code in that handler. Open that script and click in the left column next to the first line: timeRightNow = the long time. A red stop sign icon appears. Close the script window and run the program. When you click on the Update button this time, the Debugger window opens and this is what you will see:

The red stop sign icon is the breakpoint. The green arrow shows that this is the next line of code that Director will execute. In the upper left pane you can see what is called a "stack trace". It shows that we are currently in the handler ShowTime, but that was called from a handler called mouseUp (which was attached to the Update button). The values of all local variables are displayed in the upper right pane. They are all currently VOID since none has yet been assigned a value.
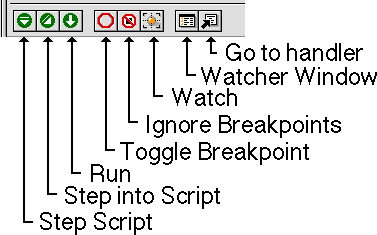
In the horizontal row above the script is a set of buttons that provide the controls of the debugger - the Debugger's tool bar. Here is what these buttons do:

The most important buttons are the first three.
The Step Script button is used to execute the current line of code (this is also known as "single stepping") and then stop before executing the next line of code.
The Step into Script button is similar to Step, but its function depends on what the current line of code is. If the current line of code involves a call to a handler and you click on the Step into Script button, Director will make the call to that handler in the current line of code and suspend execution at the first line of the called handler. If you were stopped at a line of code containing a handler call and clicked on Step Script instead, then the entire handler would execute (potentially calling other handlers as well). When the handler was finished, Director would bring up the Debugger again.
The Run button is used to continue execution. When you click on Run, the program will start executing at the current line of code.
Knowing these buttons, let's debug this code. If you click on the Step button, you will see that the green arrow moves down to the second line of the ShowTime handler, and the variable TimeRightNow is assigned a string value. So far, so good. If you click on Step again, you will see that the variable AMorPM contains an unexpected space as its first character. Looking at the code, you can see that the previous line of code called the handler GetLastTwoChars.
timeRightNow = the long time
AMorPM = GetLastTwoChars(timeRightNow)
timeOfDay = StripLastThreeChars(timeRightNow)
Seeing that it returned three spaces instead of the expected two spaces indicates that the error is in this handler.
Since Director has already executed the code for GetLastTwoChars, you need to get to a point where it can call the ShowTime handler again. You could now set an additional breakpoint at the first line of GetLastTwoChars, but let's just work our way through it. Click on the Run button in the Debugger tool bar to allow the program to continue. To reproduce the error, click on the program's Update button again.
As before, the program stops in the Debugger at the first line of the ShowTime handler. Click the Step button once to execute the first line. But now, instead of clicking on Step again, click on Step Into to go into the GetLastTwoChars handler. The Debugger steps into this handler and stops execution at the first line. Then click on Step twice, and the values of all the local variables are displayed in the upper right-hand pane.
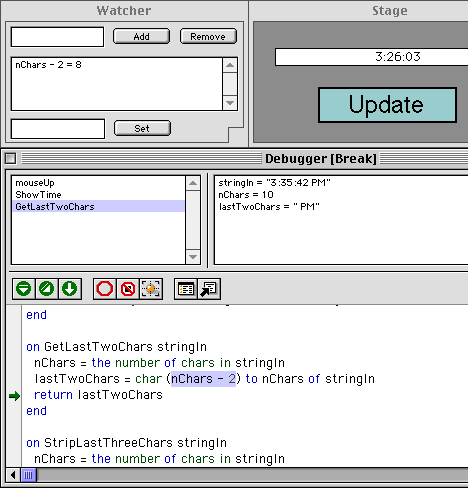
Notice that the string is 10 characters long, but Director has incorrectly returned the last three characters instead of the last two. In this case you really want to use chars 9 to 10 of the string, but the function seems to have used characters 8 to 10. To verify that this is what happened, highlight "nChars - 2" and click on the "Watch" button. The Watcher window comes up and shows us that this expression evaluates to 8 instead of 9. The bug is that the code should have used the expression "nChars - 1" instead of "nChars - 2". Here you can see the Stage, the Debugger, and the Watcher windows.

To fix the problem, click on the Go To Script button. This brings up the appropriate script at the right point so that you can edit the script to fix the error.
Runtime Errors
When certain types of errors occur in a program at runtime, Director gives you the option of using the Debugger to help track down the cause of the error. Imagine that you had coded a routine such as:
on test
testList = [1, 2, 3, 4, 5, 6, 7, 8]
x = testlist[9]
end
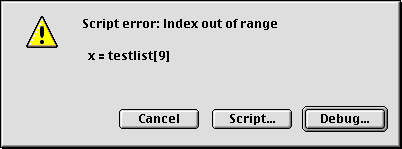
When executing code such as this, Director will recognize this as an error and give you the following alert:

If you click on the Debug button, Director will open the Debugger at the current line of execution, just as though you had set a breakpoint on it. You can then look at the value of your variables, and also look at the stack trace to figure out what handlers or events were called to get to this line of code. From the Debugger window, you can click on the Script button to get back to the current script.
Speaking of the stack trace, there is an extra hidden feature built into it as of Director 6. You can click on any line in the stack trace, and Director will display not only the code associated with that handler, but also the value of all variables local to that handler. For example let's say that you put a breakpoint in a handler called E, and you have a chain where handler A calls handler B, which calls handler C, which calls handler D, which calls handler E. When you run your program, it stops at the break point in handler E and shows the stack trace of A, B, C, D, E. If you then click on C, you can look at the line in the script of handler C where handler D was called from, and all the local variables and their values in handler C. This is very useful for tracking down errors where incorrect values are passed down through layers of calls.
Debugger Menu options
Some of the Debugger commands are repeated in the Control menu. Two commands are worth individual mention:
Remove All Breakpoints eliminates all breakpoints that have been set in all scripts. This saves you the trouble of finding and clearing each one individually.
Ignore Breakpoints is actually a toggle. It starts off FALSE -- that is, all breakpoints are obeyed. If you select it once, the stop signs turn grey and all breakpoints will be ignored. Temporarily ignoring breakpoints is very handy in some debugging sessions.
A Pair of Tricks
If you are attempting to debug code dealing with the mouse (e.g., clicking on buttons, dragging, etc.) using the Debugger can be a bit difficult because moving the mouse to click on the Debugger control buttons can change the values of the mouseLoc making the problem that were trying to debug more difficult to resolve. The main three buttons of the Debugger (Step, Step Into and Run) also have keyboard shortcut keys so you don't have to use the mouse while debugging:
| Function | PC | Mac |
| Step | F10 | Command Option Shift Up Arrow |
| Step Into Script | F8 |
Command Option Shift Right Arrow |
| Run | F5 | Command Option Shift Down Arrow |
Sometimes during development, you want to have some "defensive coding". That is, code that will catch errors during the development cycle. As an example, you may have a handler that expects a value between 1 and 10, or code that depends on a limited set of symbols for use in a case statement, or code that must be passed a string, etc. In these cases, if an invalid value is passed in as a parameter, you would like to know where that value came from. Looking at the stack trace would be ideal. Here is an example of what we can do if handler must get a value between 1 and 10:
on SomeHandler someParam
if (someParam < 1) or (someParam > 10 then
alert("Invalid value of someParam in SomeHandler:" && someParam
DebuggerBreak() -- this is an undefined handler
end if
end
If an invalid value is passed into this handler two things will happen. First, an alert will display telling you that an invalid value had been passed to the handler and what that value is. Then when you click on the OK button to dismiss the alert, the code tries to execute a call to a handler called DebuggerBreak. This handler is left undefined deliberately so that Director will generate an error dialog. If you click on the Debug button at this point, you can look at your stack trace.
Summary
The Debugger is an essential tool for diagnosing program errors. Allowing you to step through your code will help you identify where you have made a mistake. You can see what path you are taking through your code and what values you have in your variables. Knowing these two things will help you track down errors much quicker than put statements and/or alerts. Once you incorporate it into your daily development routine, you won't know how you got along without it.
Copyright 1997-2026, Director Online. Article content copyright by respective authors.